
Wiseline has development the tool Wiseline Asset Insight (WAI) that enables power grid companies to understand their cost and risk drivers enabling them to optimise their maintenance program. Every year there are thousands of both planned and unplanned interruptions on the electrical power grid in Norway. These disconnections result in undelivered energy that cost the society millions each year. The year 2016 saw a total of 25 777 incidents totalling a loss of 8 239 MWh undelivered energy (Statnett, 2017). Assuming an average interruption of 1,3 hours (Kjølle, 2011), the cost of undelivered energy is approximately 30,7 NOK per kWh. This equals 253,2 million NOK, or over 32 million USD.
Wiseline, with partners (e.g. Safetec and IFE), have worked to utilise the vast amount of inspection data into data driven decision support. The result is a ground-breaking tool enabling the power grid company to decrease both the number of power grid interruptions and saving inspections cost at the same time. WAI achieves this in two main steps;
1) Processing inspection data and estimating the state of the power grid and how this affect the risk related to personnel and loss of power.
2) Using life time analysis to estimate how components deteriorate and use this to predict the future state of the power grid by. WAI can simulate the impact inspection and maintenance have on the state of the power grid and use this to determine the optimised maintenance and inspection strategy for all parts of the power grid.
The results from WAI is imported into Power BI to create interactive dashboards where the power grid company gets a full overview of the risks on each line. WAI can also help power grid companies to determine which power lines and posts to inspect the following period, and based on inspection data determine which component to maintain. All of this can be presented with intuitive graphs and maps together with the results from the analysis leading up to the optimised strategy. The pictures below illustrate some of the results that are presented in Power BI.
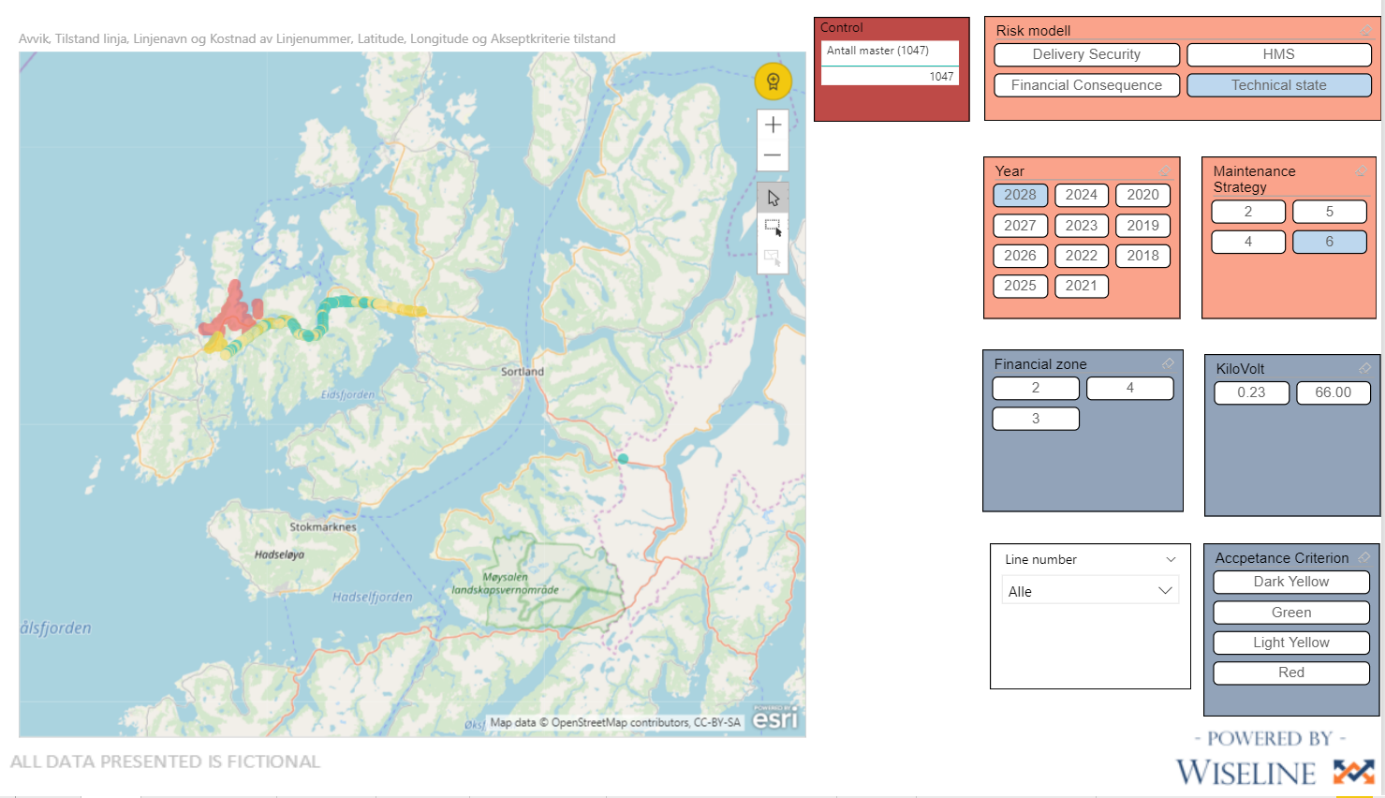
Overview of risk on the the different lines and posts.
Number of deviations for each subsystem the next 10 years based on different maintenance strategies.
The two graphs at the top show how the state of the power grid deteriorates based on different maintenance strategies for the next 10 years. The two graphs at the bottom show the cost related to each maintenance strategy and illustrate that it is possible to reduce the costs significantly by choosing the right strategy.